MONITORING / BUILD STORY
EvolvingZedMon.
Less tab hunting. More situational awareness.
01 / THE BUILD
Give the lab its own window.
ZedMon brings the monitoring tools together on a dedicated display. Debian, Grafana, Prometheus, Uptime Kuma, kiosk mode, and TigerVNC form the working foundation.
02 / THE BUILD
Different questions, different tools.
Prometheus collects metrics, Grafana turns them into readable dashboards, and Uptime Kuma checks service reachability. Combining those views makes the lab easier to understand than a collection of separate tabs.
03 / THE BUILD
A dashboard has to earn its space.
The blue NOC overview is the chosen direction. A separate network-map experiment was set aside. The focus is a useful overview rather than adding a visual simply because it is possible.
04 / THE BUILD
Moving toward cluster operations.
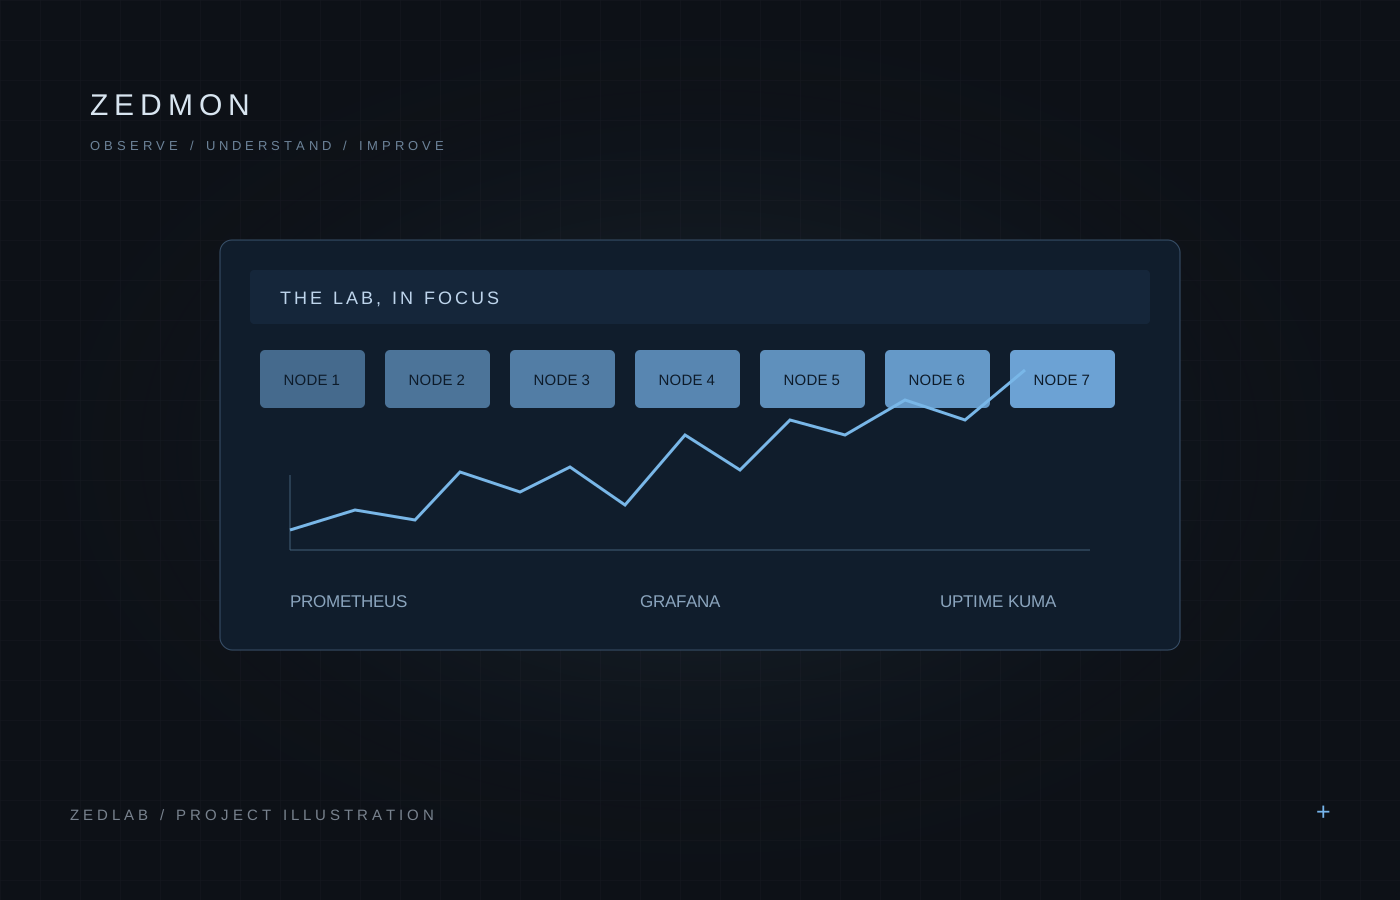
The next stage is a clearer view of all seven Proxmox nodes, their workloads, and important services. Cluster-specific metrics and additional health checks are the direction of travel, rather than a claim that every panel is finished.
THE TAKEAWAYThe most useful dashboard helps you notice what deserves attention without making you decode the screen.
STILL CURIOUS
What’s next?
Expand the overview with Proxmox-specific metrics and additional service health checks.
Have a thought on this build?